Cloud Platform Operation Manual
1. Logging in to the Data Dashboard
Enter the URL https://energy.topband.com.cn in the browser to access the cloud platform login interface, then log in to enter the cloud platform data dashboard interface.
1.1 Login
Accounts and passwords are assigned through the backend management system; enter them to log in.
Register by providing a mobile phone number or email, then set a password. Users can log in using the password.
1.2 Click the language dropdown box in the upper right corner of the login interface to switch the platform language between Chinese and English
2. Data Dashboard Interface

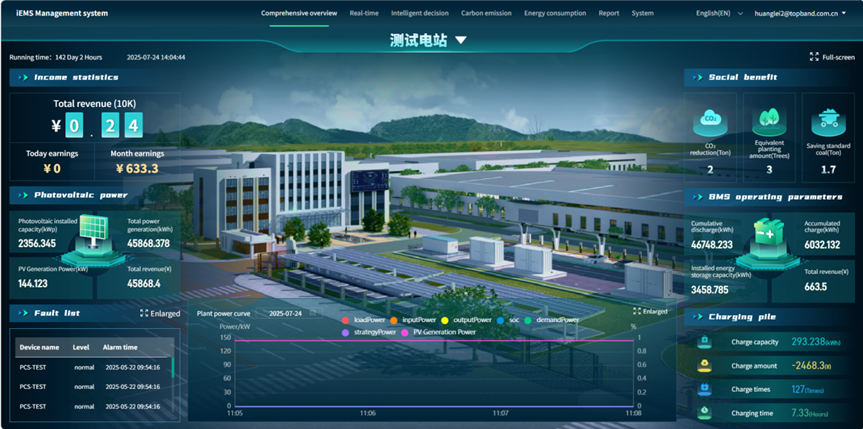
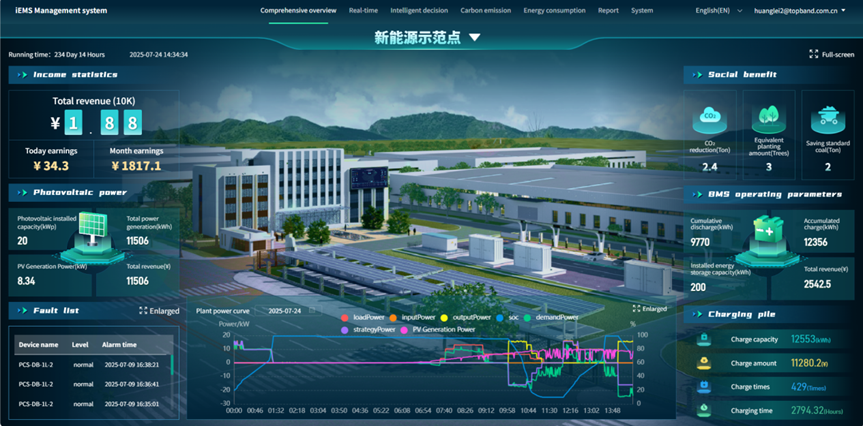
2.1 Power and Revenue
Revenue includes total revenue, today's revenue, and monthly revenue; power includes cumulative charging/discharging; energy storage installed capacity; cumulative photovoltaic power generation, real-time photovoltaic power, photovoltaic installed capacity; charging pile power, charging amount, charging duration, and charging times.

Energy storage revenue
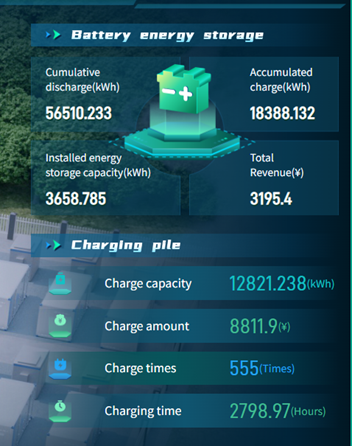
Energy storage and charging station capacity
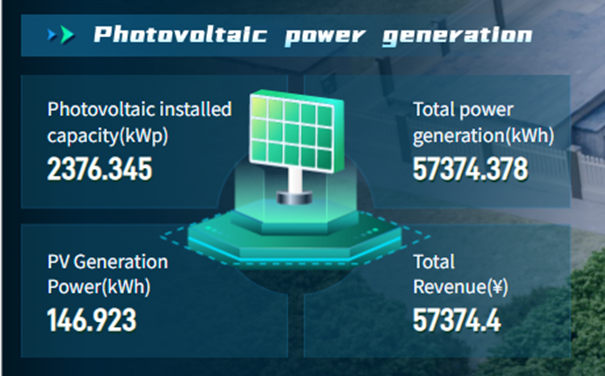
photovoltaic
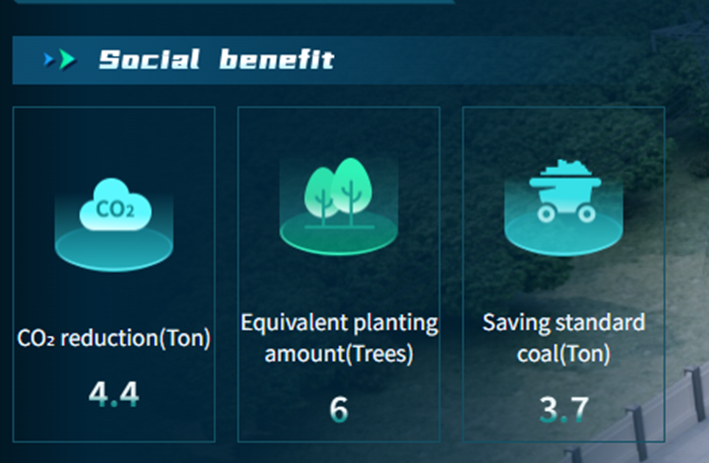
2.2 Social Benefits
Including the amount of standard coal saved, CO₂ emissions reduced, and equivalent number of trees planted.
2.3 Accessing Single Power Station Projects from the Data Dashboard
Select the corresponding power station project from the power station list and click "Enter" to access the single power station project. You can filter by power station type and system type in the upper right dropdown box, or enter the power station name and click the search button for filtering.
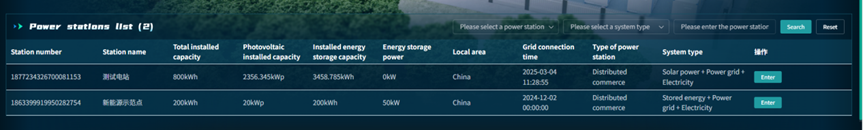
List of power stations
2.4 Exiting a Single Power Station
Click the iEMS Management system LOGO icon in the upper left corner to return to the data dashboard. You can also switch between different power stations in the central power station name dropdown box, or log out and return to the login interface via the account dropdown box on the data dashboard.
Single power station
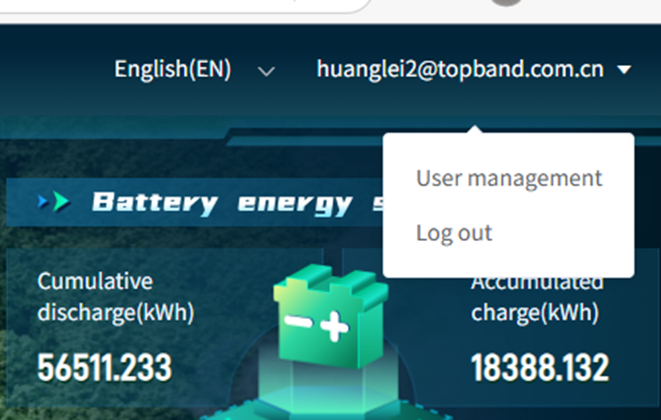
Log Out
3. Operation of Single Power Station Project Interface
After accessing a single project interface, it is mainly divided into 7 modules: Comprehensive Overview, Real-time Monitoring, Intelligent Decision-making, Carbon Emission Management, Energy Consumption Overview, Report Management, and System Management.
3.1 Comprehensive Overview
It mainly includes power and revenue (total revenue, today's revenue, monthly revenue; cumulative charging/discharging; energy storage installed capacity; cumulative photovoltaic power generation, real-time photovoltaic power, photovoltaic installed capacity; charging pile power, charging amount, charging duration, charging times), the power station fault list (can be enlarged for viewing), and important power curves of the power station.
3.2 Real-time Monitoring
Real-time monitoring includes three parts: System Electrical Diagram, Equipment Operation Monitoring, and Alarm Management.
3.2.1 System Electrical Diagram
Including System Diagram and Electrical Diagram.
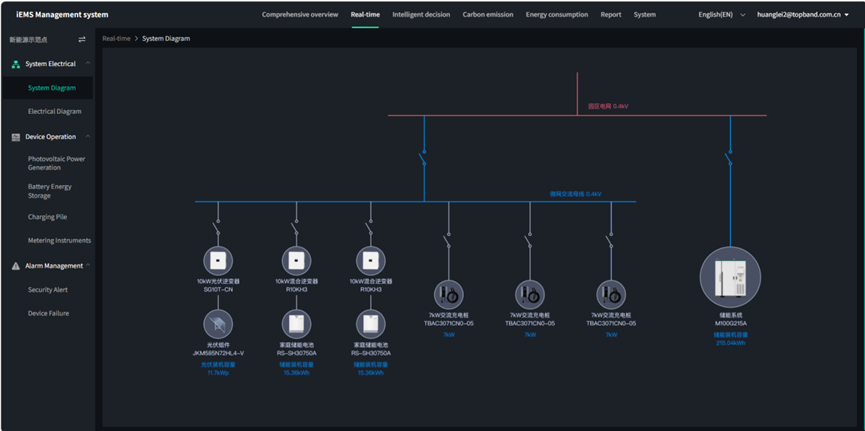
System Diagram
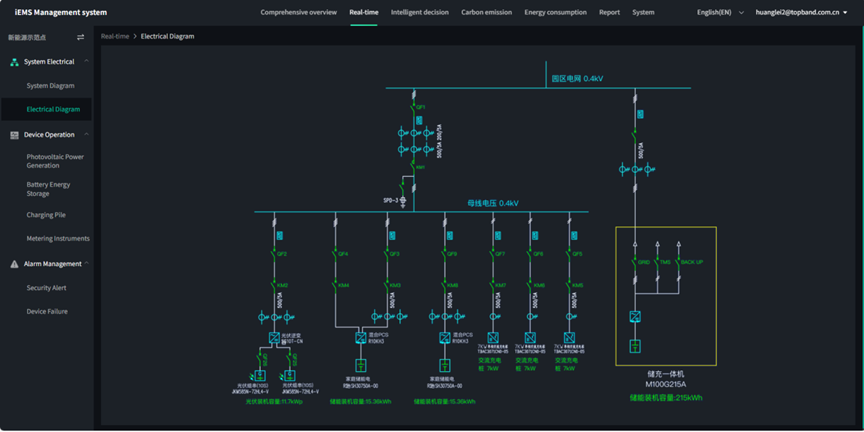
Electrical Diagram
3.2.2 Equipment Operation Monitoring
Including Photovoltaic Power Generation, Battery Energy Storage, Charging Piles, and Metering Instruments.。
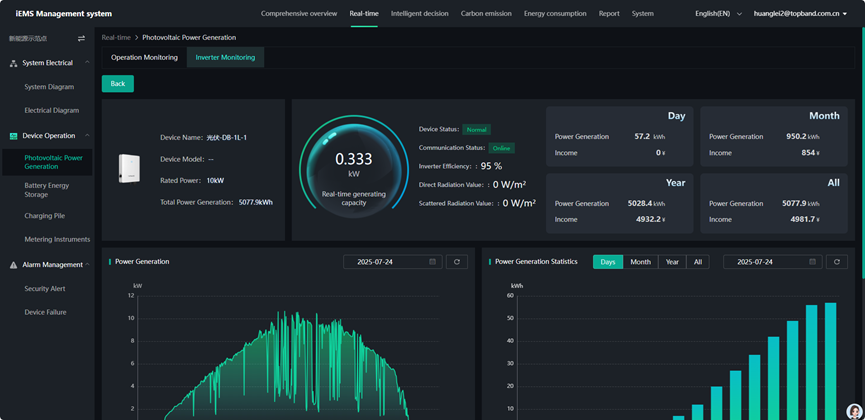
(1) Photovoltaic Power Generation
- Operation Monitoring
Including photovoltaic power generation and revenue data, which are statistically displayed by total, year, month, and day. The power generation is shown with corresponding bar charts, and the date can be selected for display. It also shows photovoltaic power generation curves by date selection, as well as meteorological information, CO₂ emission reduction, and standard coal savings.
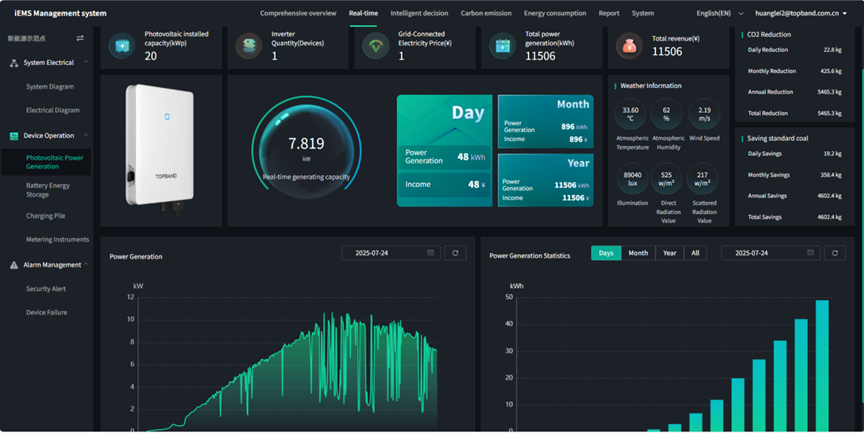
Photovoltaic power generation operation monitoring
- Inverter Monitoring
Including the number of devices, whether they are online, the number of normal devices, the number of faulty devices, and the status of the devices.
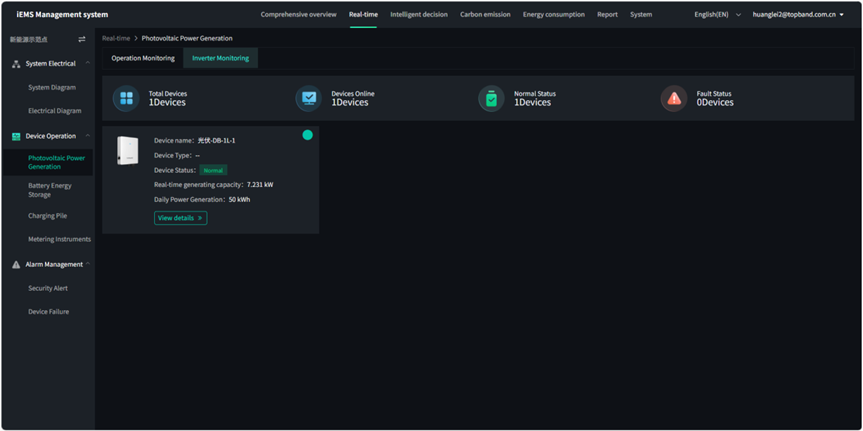
Photovoltaic inverter monitoring
- Viewing Device Detailed Parameters
Click "View details" to check the detailed parameters of the device.
Detailed parameter monitoring of inverters
(2) Battery Energy Storage
- Operation Monitoring
Mainly including the total annual, monthly, and daily charging/discharging capacity of energy storage, with statistical bar charts switchable by total, year, month, and day, and the date can be selected. It also includes revenue analysis, with statistical bar charts switchable by total, year, month, and day, and the date can be selected. It displays key parameter information of PCS and BMS: PCS includes DC side voltage and current; AC side three-phase voltage and current, total active power, total reactive power, device operation status, and communication status. BMS includes voltage, current, SOC, daily charging/discharging capacity, device operation status, and communication status.
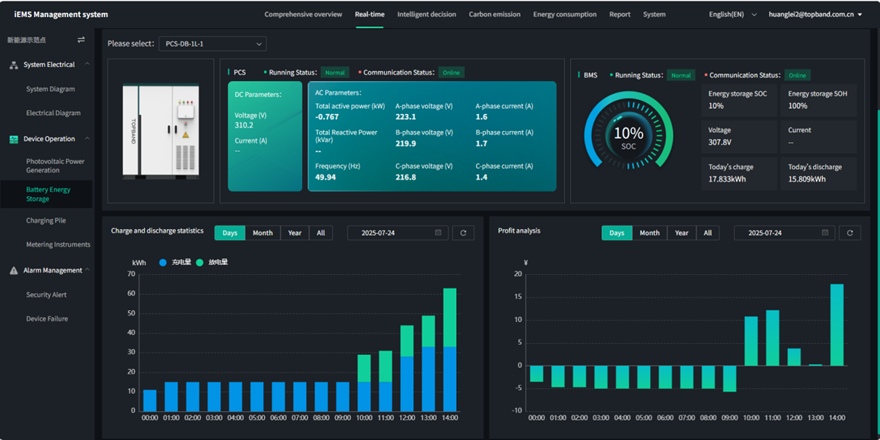
Battery energy storage operation monitoring
- System Equipment
Including the number of devices, online status, number of normal devices, number of faulty devices, and device status.
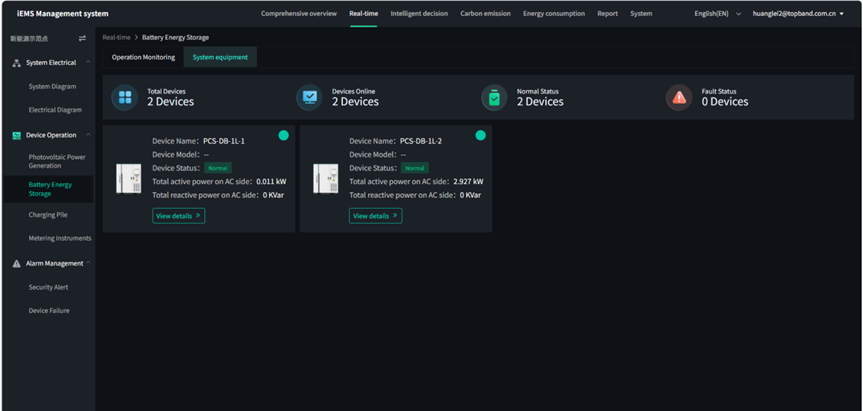
Battery energy storage system equipment
- Viewing Device Detailed Parameters
Click "View details" to check the detailed parameters of the device.
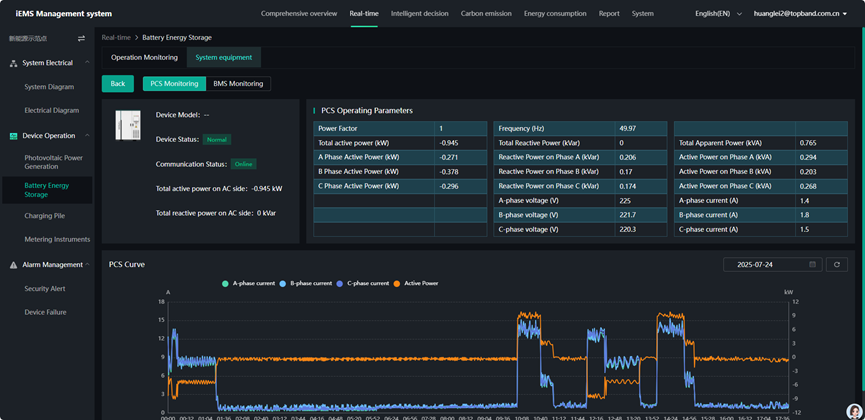
Detailed parameters of battery energy storage equipment
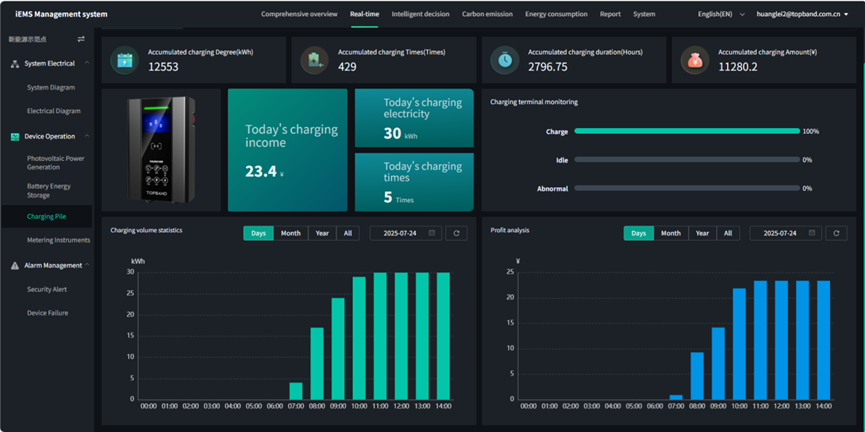
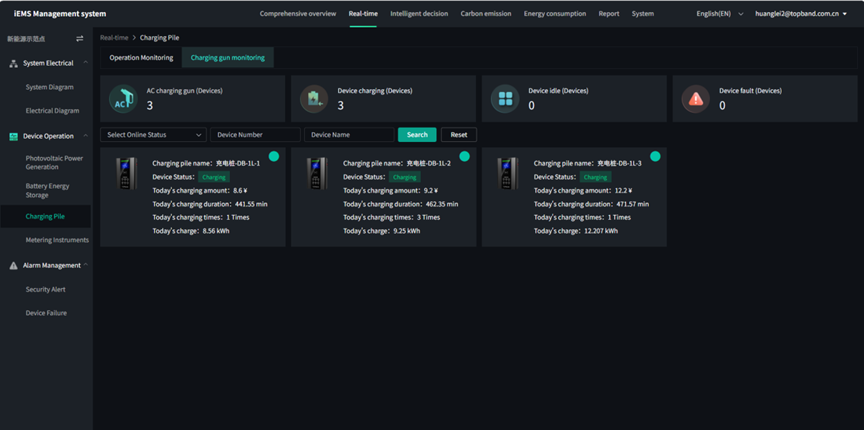
(3) Charging Piles
Including Operation Monitoring and Charging Gun Monitoring.
- Operation Monitoring
Displaying charging capacity and revenue analysis by total, year, month, and day, with bar charts switchable by total, year, month, and day, and the date can be selected. It also displays cumulative charging times, charging amount, and charging duration.
Operation Monitoring
- Charging Gun Monitoring
Including the number of AC charging guns, faulty devices, charging devices, and idle devices. It also shows the status of each charging pile (charging, idle, etc.), today's charging amount, charging duration, charging times, and charging capacity.
Charging Gun Monitoring
(4) Metering Instruments
Mainly for metering photovoltaic, energy storage, and other data through electric meters.
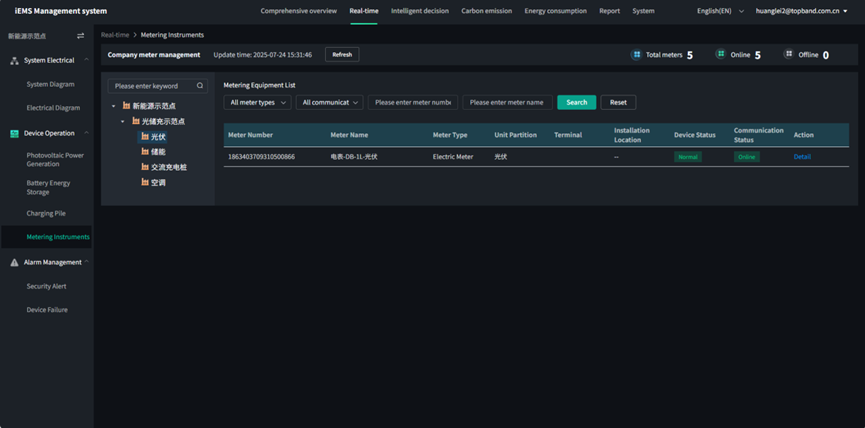
- Viewing Device Detailed Parameters
Click "Detail" to check the detailed parameters of the device.
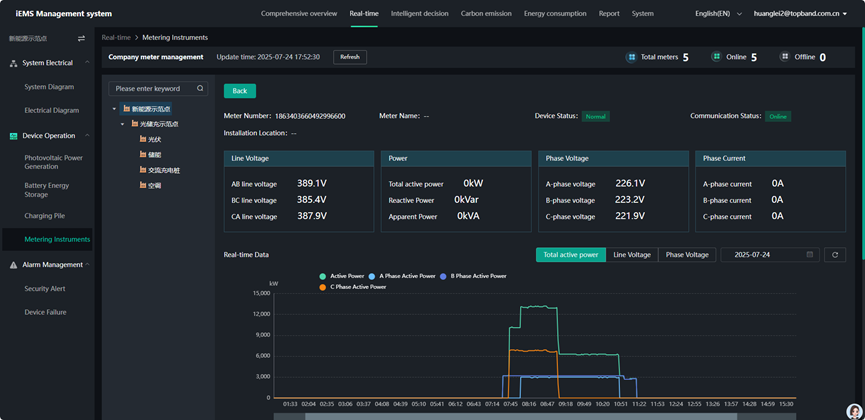
Detailed parameters of metering instruments
3.2.3 Alarm Management
It mainly includes Security Alerts and Device Failures.
(1) Security Alerts Including real-time monitoring of alarms from various devices in the energy storage system.
You can filter by device type and alarm level, select the query date, and then view the alarm information of the corresponding devices in the list.
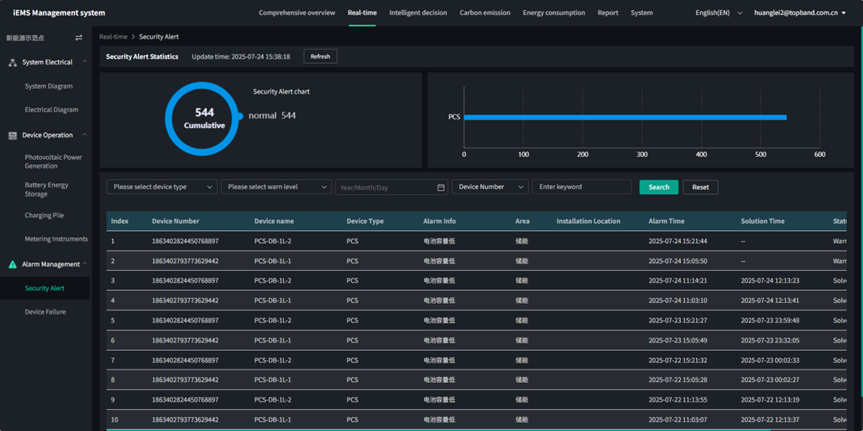
Security Alerts
(2) Device Failures Including real-time monitoring of failures of various devices in the energy storage system.
You can filter by device type and failure level, select the query date, and then view the failure information of the corresponding devices in the list.
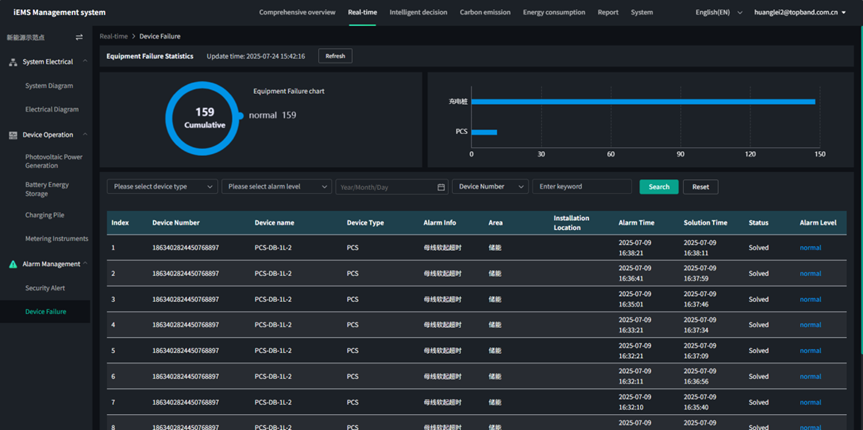
Device Failures
3.3 Intelligent Decision-making
Including Photovoltaic Forecast, Energy Storage Operation Strategy, and Load Forecast.
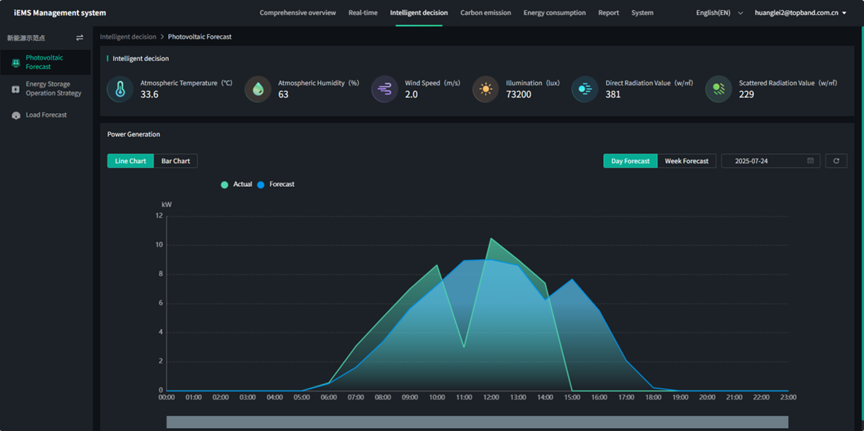
3.3.1 Photovoltaic Forecast
Including meteorological information and line charts and bar charts of actual and forecast power of photovoltaic power generation, with switchable day and week views.
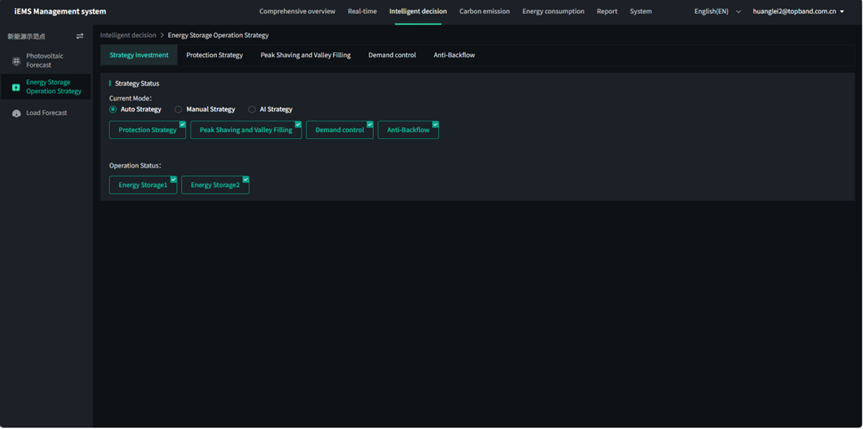
3.3.2 Energy Storage Operation Strategy
Including Strategy Investment, Protection Strategy, Peak Shaving and Valley Filling, Demand Control, and Anti-backflow.
(1) Strategy Investment
Mainly for setting whether the protection strategy, peak shaving and valley filling, demand control, and anti-backflow are effective, and setting the current mode as automatic strategy, manual strategy, or AI strategy.
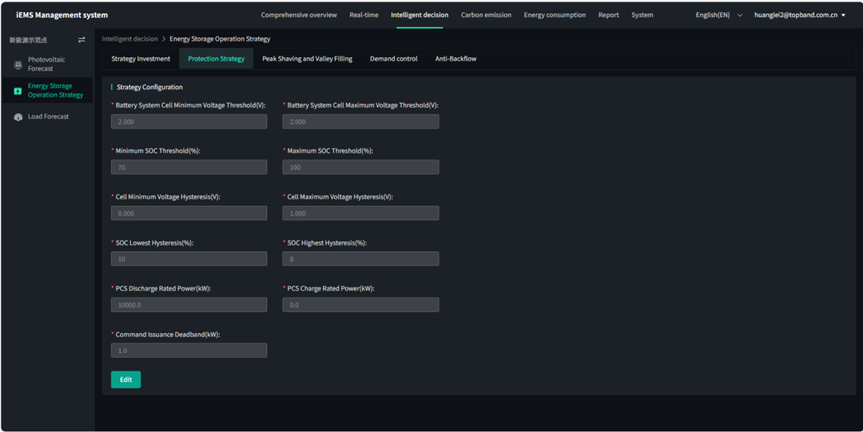
(2) Protection Strategy
Mainly for setting system protection parameters, such as the minimum cell voltage of the system battery. Click "Edit" to modify parameters, then click save, and the data will be sent to the device.
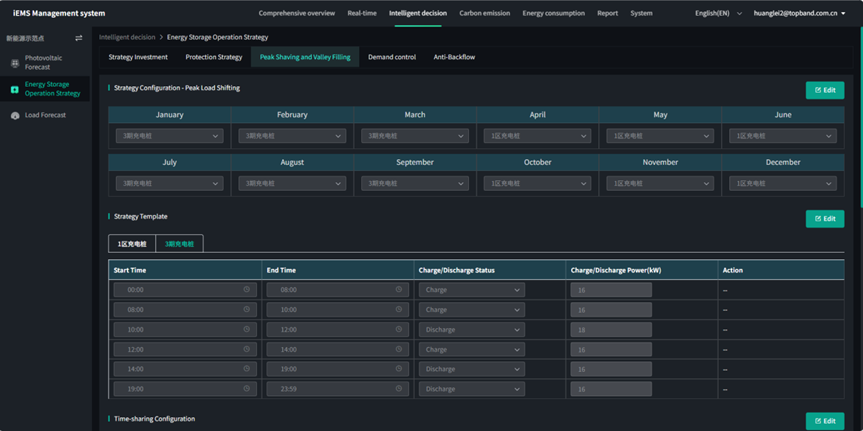
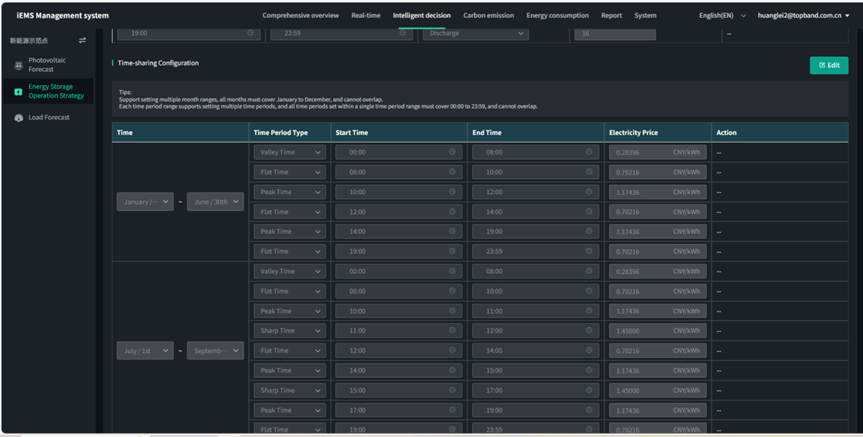
(3) Peak Shaving and Valley Filling
You can configure monthly operation strategies and set various operation strategy templates, with charging/discharging power set for different time periods. You can also set peak, flat, and valley time period electricity prices for different months and time zones. Similarly, click "Edit" to enter the editing state, then click save, and the settings will be sent to the device.
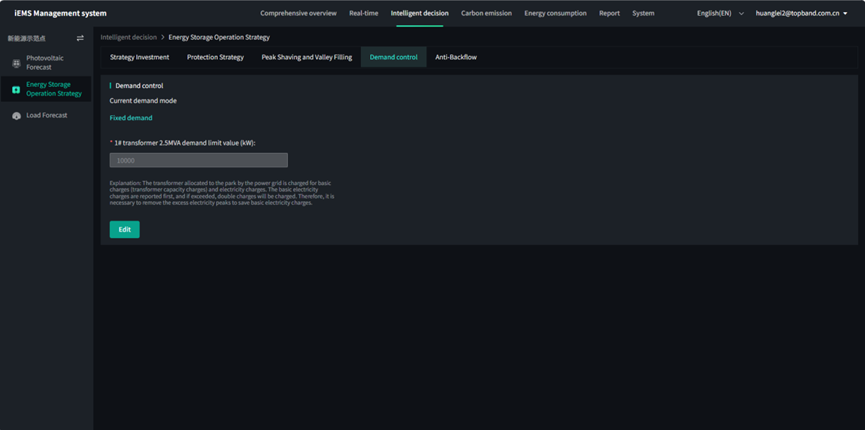
(4) Demand Control
You can set a fixed demand.
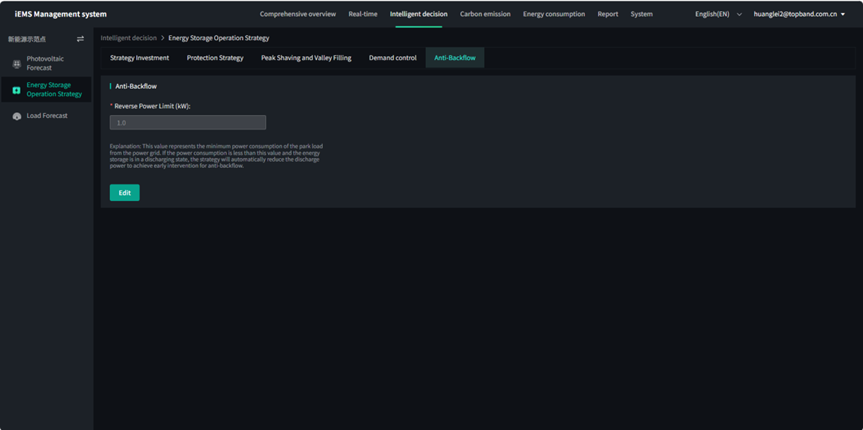
(5) Anti-backflow
You can set an anti-backflow limit value.
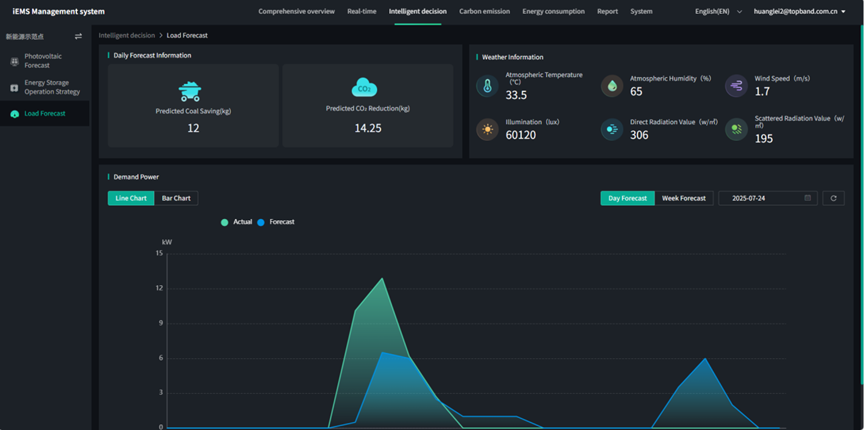
3.3.3 Load Forecast
Including meteorological information and line charts and bar charts of actual and forecast power of load demand, with switchable day and week views.
3.3.4 Carbon Emission Management
Including Item Overview, Carbon Emission Display, and Carbon Emission Flow.
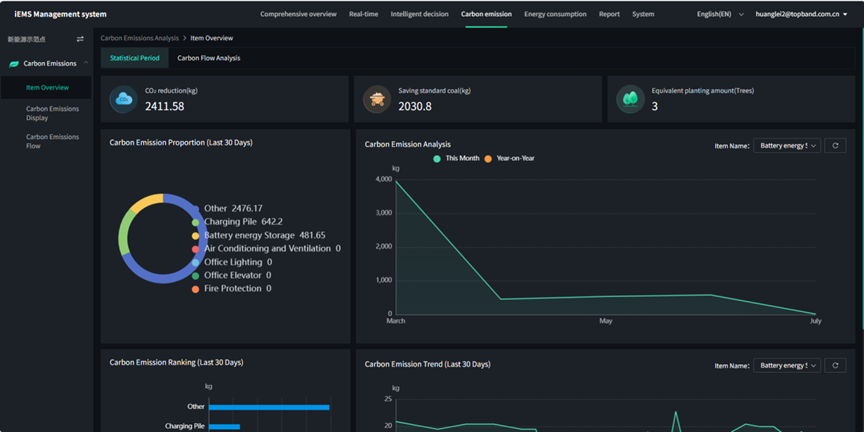
Item Overview
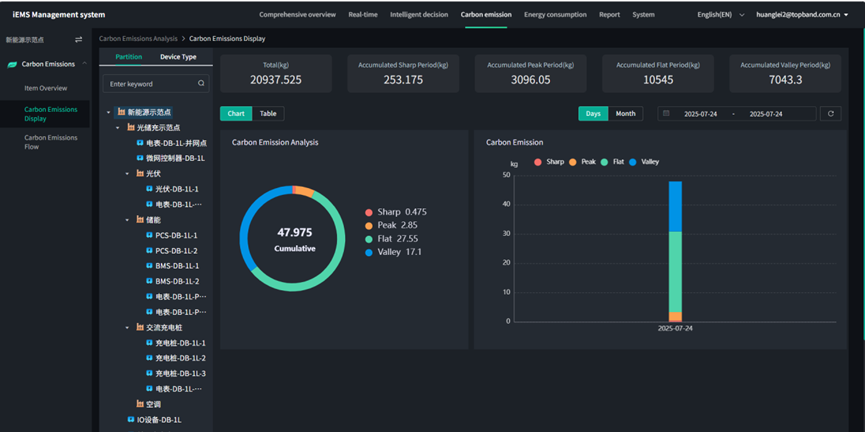
Carbon Emission Display

Carbon Emission Flow
3.3.5 Energy Consumption Overview
Including Item Overview, Energy Consumption Display, and Energy Flow.
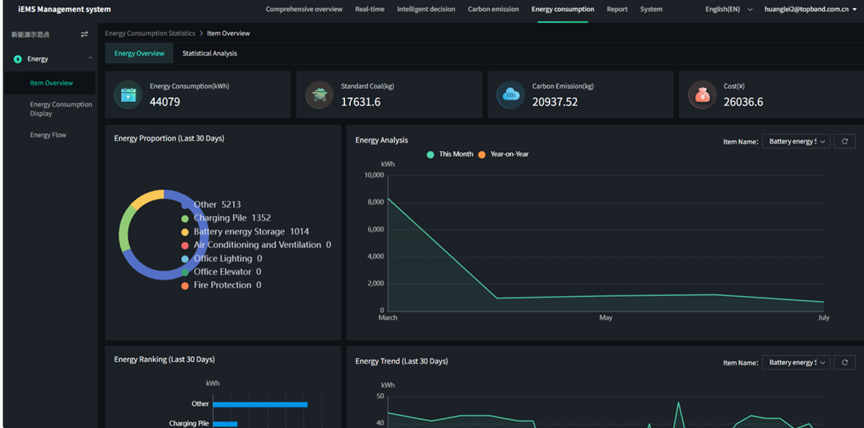
Item Overview
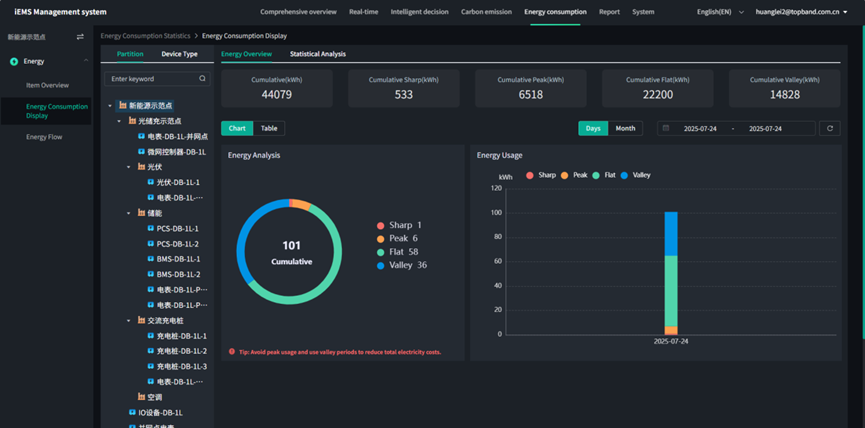
Energy Consumption Display
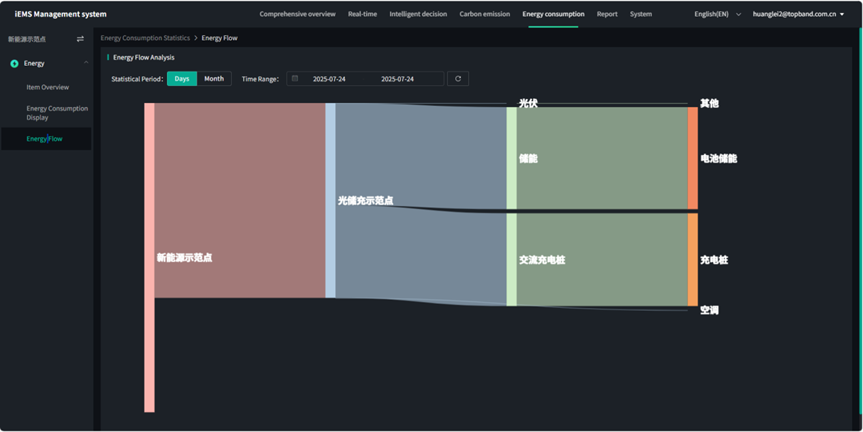
Energy Flow
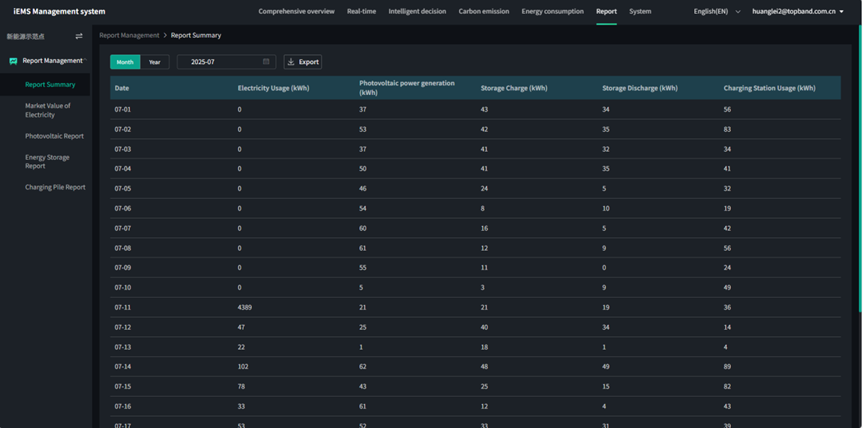
3.3.6 Report Management
It counts the specific power consumption of different devices, and can export the daily, monthly, and annual power consumption and specific revenue of specific devices with one click.
3.3.7 System Management
Including Basic Information of Power Station, Electricity Price Setting, Calibration Quantity Configuration, Zone Configuration, and Equipment Management.
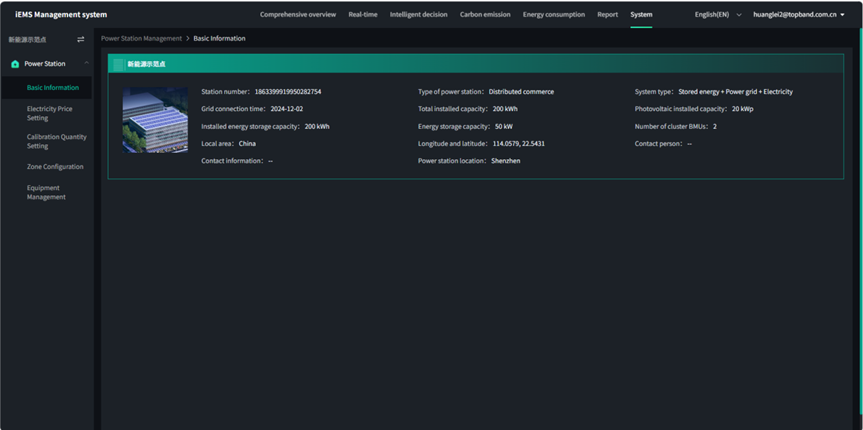
Basic Information of Power Station
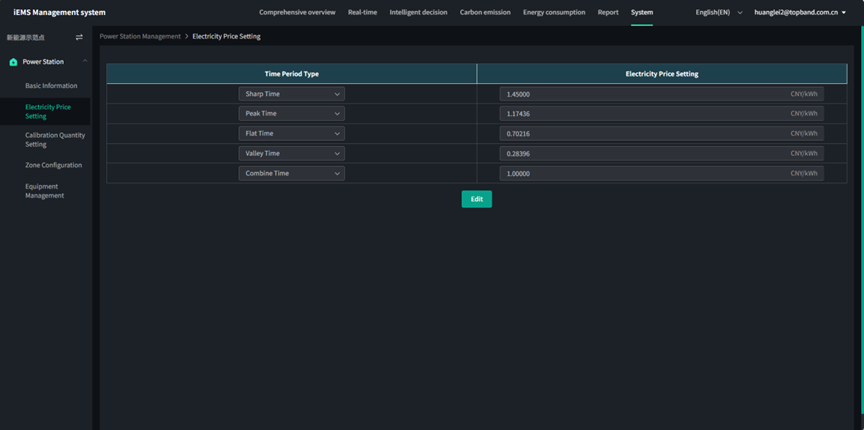
Electricity Price Setting
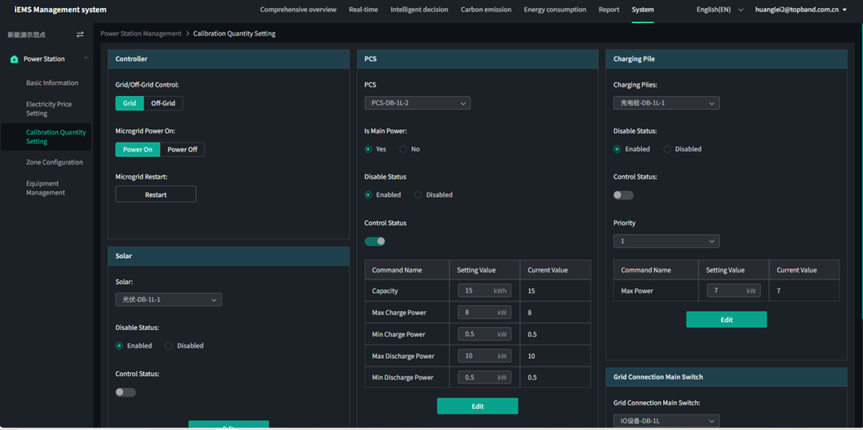
Calibration Quantity Configuration
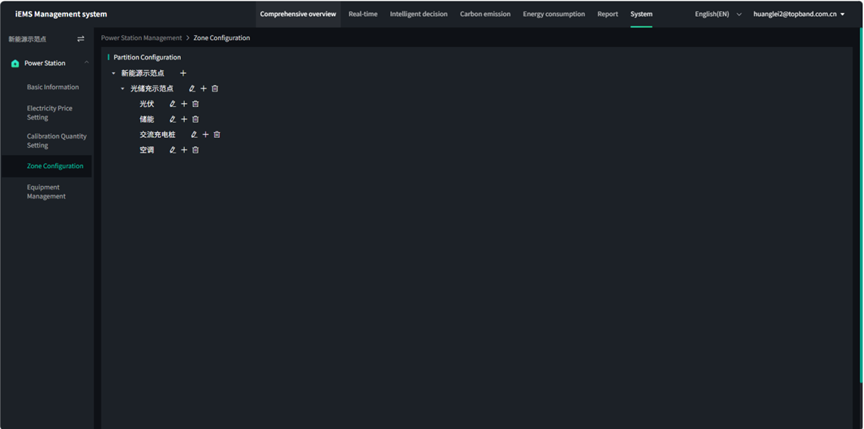
Zone Configuration
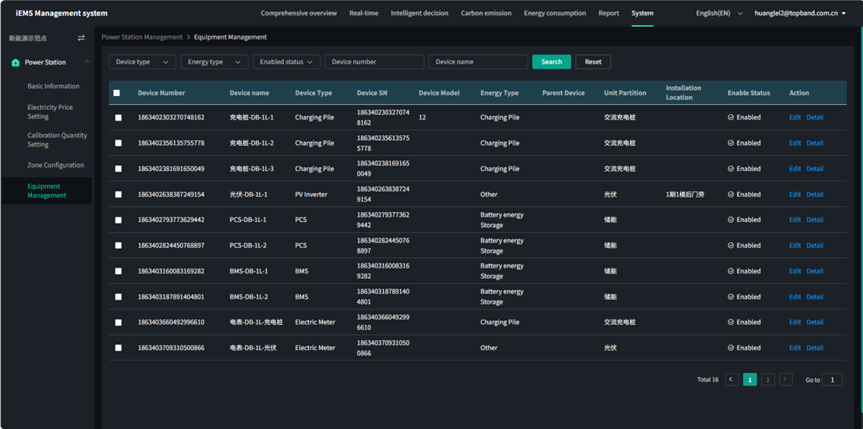
Equipment Management